January 25, 2023 Angular Web-Development
Angular Performance Tunning
We had reports of our Open Layer Map - npm view was hanging after zooming and panning on occasion. It works great for most of our use cases. The browser would actually crash after it used up all of the RAM on the system and didn’t release it. We have options for many layers on our map. I was asked to take a look.
Step 1: update packages
Our npm package was 2 major versions behind, so I first updated that. This was surprisingly as there weren’t any breaking changes and just a few TypeScript types to update. We didn’t notice anything break after deploying it, but it didn’t solve the performance issue.
Updating our Angular version has been on the list and would probably help this well. Someday we’ll do it!
Step 2: profile the app and experiment with changes
We used Windows task manager, Chrome Dev Tools (Performance and Memory tabs) and the Angular extensions profiler. I still have much to learn about profiling, so I found
4 Runtime Performance Optimizations - From Minko Gechev in 2022
showing how to use the Angular extension profiler to look for changes. I’ve had to rewind and watch it several times. I recognized that there are onchanges emitted every time I pan or zoom, so I worked to optimize that (if the layer is off, don’t do work using
RxJS - operators
skipwhile()). That didn’t solve everything.
I noticed another component changing a lot and changed it to ChangeDetectionStrategy.OnPush, but not much difference. The previous developer used this a lot already on most of our components and
this._ngZone.runOutsideAngular()
for OL map commands, but I found a few more spots to change to that.
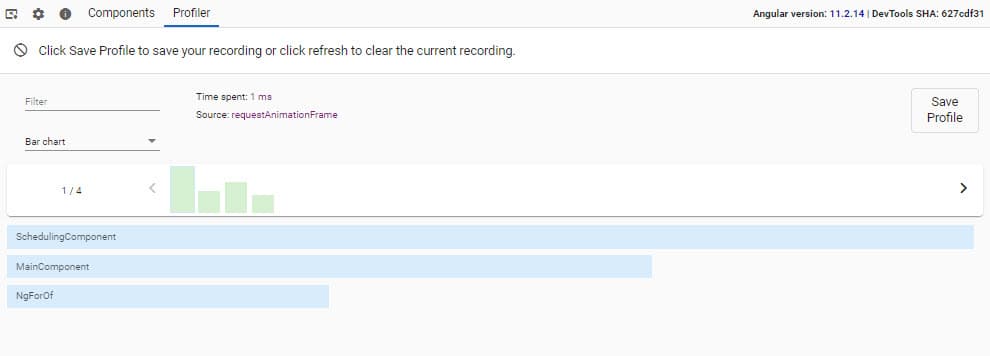
Before there were a lot of RequestAnimationFrames.

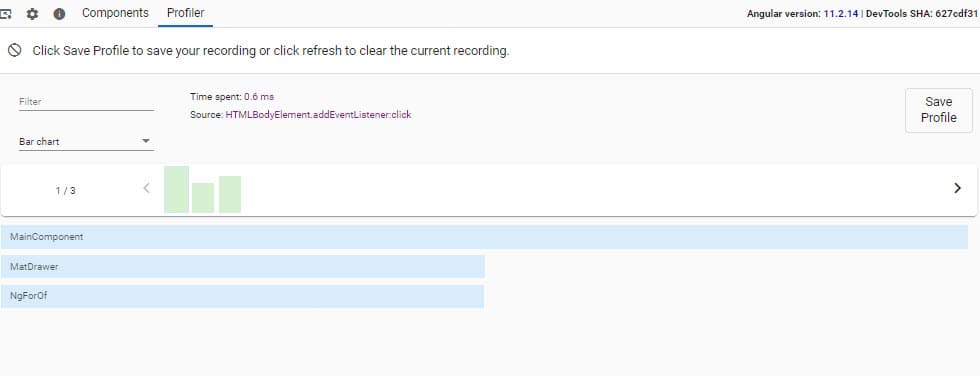
After the change, I’m not seeing them on map panning.

It’s hard to tell if it is performing better, but the profiler has less changes detected so that’s a win.
Remove events that aren’t being used I also found I could remove an event emitter from map moved that wasn’t being used. More progress.
I do have a chain of components so I need to look there as well. This one will be lot more involved, so I think I’ll have to move on before solving this completely, but hopefully I can make some improvements. It’s a complex application! (I finished this article and was re-reading it and I’m thankful I was able to improve without having to ask for several days more to figure this out)
Experiment: I suppose this might help, make the change, profile, compare to the previous profile. Did it improve or make things worse or stay the same?
Step 2b: What about that memory leak?
I was ready to use the Chrome Dev Tool and take some memory snapshots (hoping something obvious would become apparent), but I ran it again and now the CPU and memory usage are both staying it much lower! I’m very thankful for this.
Step 2c: Hold on, we need that map moved event…
Whoops, I guess that was needed. I added it back in and see the memory leaking, thought CPU usage seems to be ok.
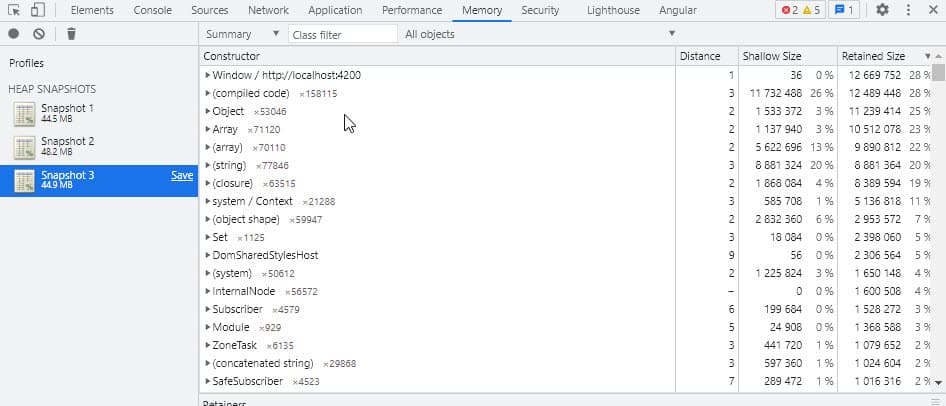
I took heap snapshots after page load and after panning. Remember to click the trash can to collect garbage first.

I’ll focus on the top ones and read more from Fix memory problems - Chrome Developers which is old, but still has some good things.
RxJs
I also need to look into How to avoid memory leaks with complex RxJS pipes in Angular 9? - Stack Overflow which links to 6 Ways to Unsubscribe from Observables in Angular | by Chidume Nnamdi .
I have an observable for each layer the same Subject.next for multiple layers, I looked at multicasting -> Angular - Using observables to pass values , but that wasn’t quite what I needed. I decided that less events would mean less CPU and memory Debouncing and Throttling Explained Through Examples | CSS-Tricks - CSS-Tricks which comes from lodash - npm .
I’ve got 2% for detached elements, maybe moving to [hidden] from *ngIf would help or updating to 14. listeners invoked inside embedded views cause a memory leak · Issue #42848 · angular/angular · GitHub is marked as fixed for Release v14.0.0-next.8 · angular/angular · GitHub
There’s more I could probably do, but I have to move on to other tasks.
Step 3: Record evidence before and after to prove the improvement
I’m going to make 2 short videos with the Windows Task Manager in view to show the difference for my team.
Step 4: Re-test after the changes
Now it’s time to test again, ask QA for help and deal with anything I missed.
Step 4: Ship it
Get this change out to production and wait for feedback. Smaller batch sizes are better according to the research in Accelerate .
Side note: Chrome Browser Tabs to Links | Blog has been a really useful tool to write this post and I will continue using it.
Please consider using Brave and adding me to your BAT payment ledger. Then you won't have to see ads! (when I get to $100 in Google Ads for a payout, I pledge to turn off ads)

Also check out my Resources Page for referrals that would help me.
Use Swan Bitcoin to onramp with low fees and automatic daily cost averaging and get $10 in BTC when you sign up.